Mining Following Relationships in Movement Data (ICDM'13)
In this page, we show the dynamics of following patterns discovered by our method in real movement data. The whole data set consists of a group of 26 baboons tracked from August 1 to August 27, 2012 in Laikipia, Kenya. The sampling rate of this dataset is 1 sample per second. We show three cases of following relationships detected by our method.
Case 1
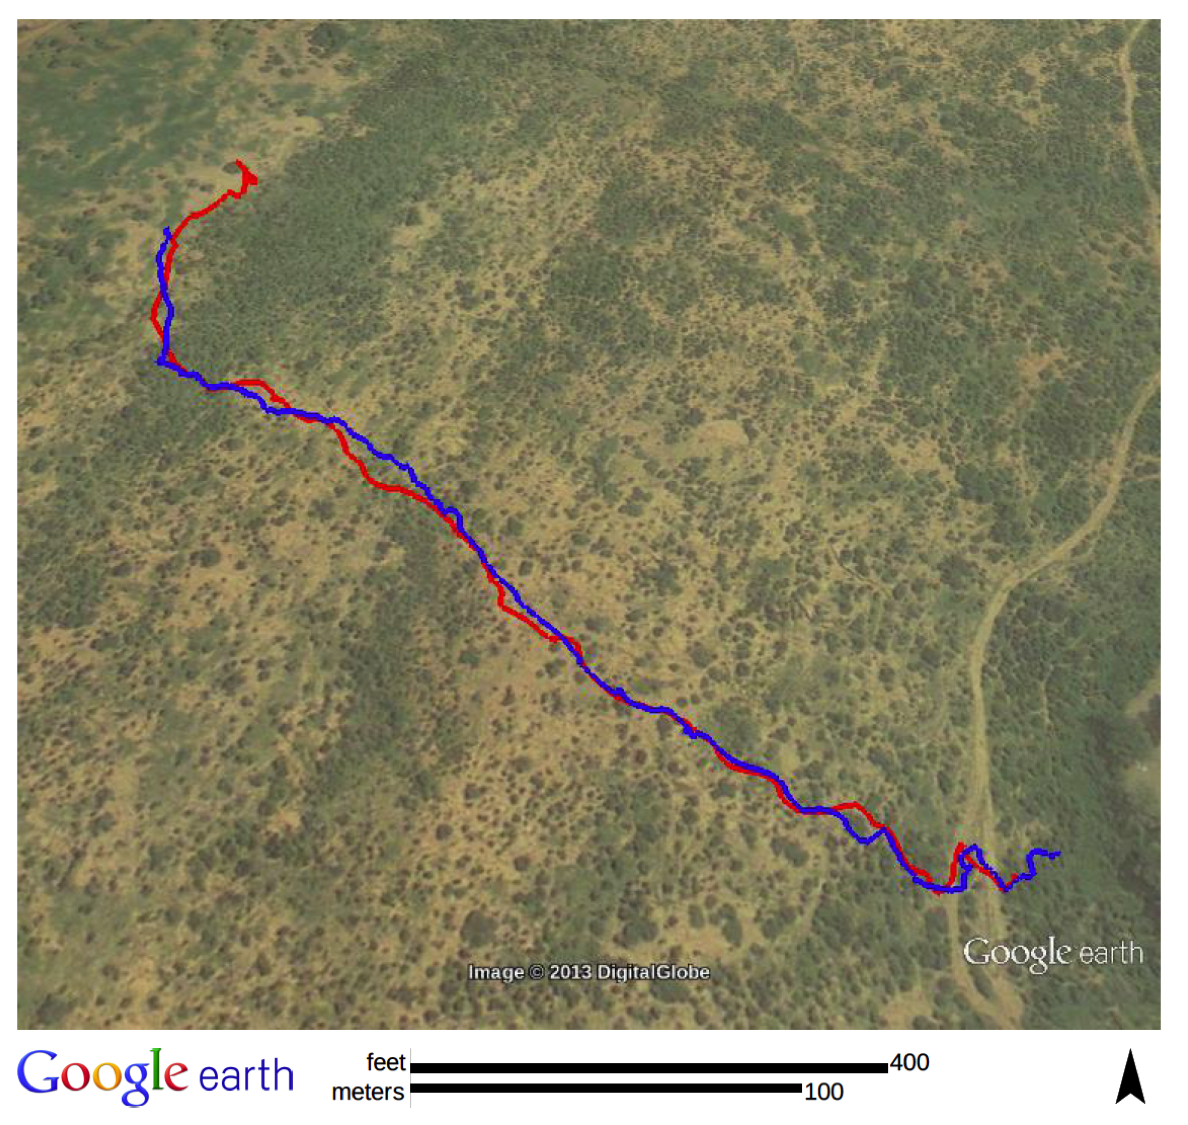
This video corresponds to the case showed in Figure 7(a). This range of following is captured in 8:00 AM-9:00 AM on August 5 between two baboons. In this range, Baboon B (blue) follows A (red) for about 9 minutes.
Figure 7(a) in paper
Animation using Google Earth
Animation using Matlab
Case 2
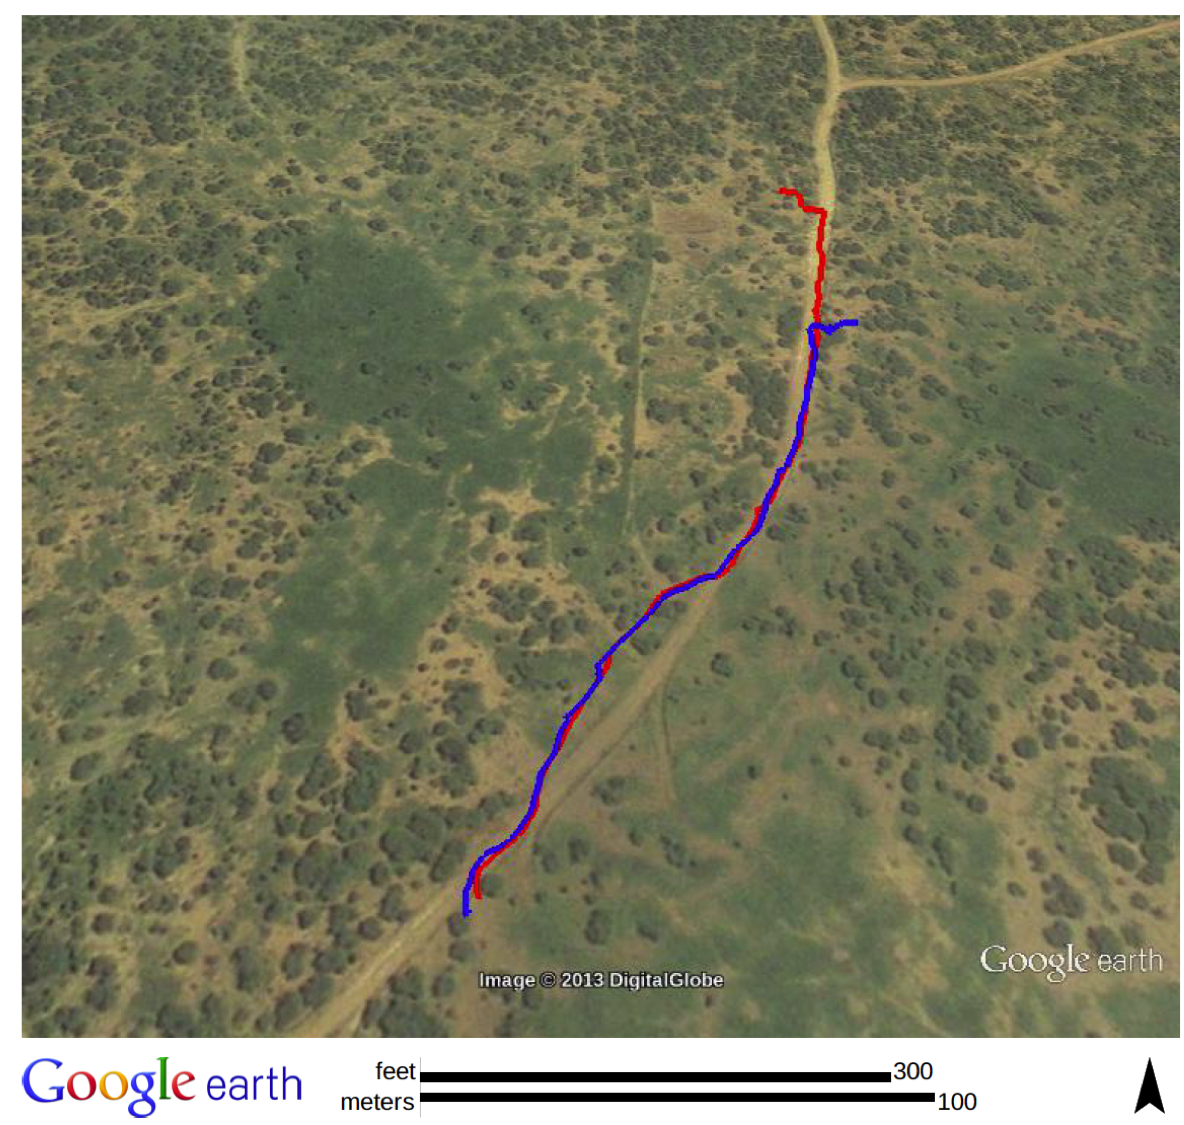
This video corresponds to the case showed in Figure 7(c). This range of following is captured between 9:00AM - 10:00AM on August 3. The following relationship lasts for 4 minutes in this captured range and still Baboon B (blue) follows A (red).
Figure 7(c) in paper
Animation using Google Earth
Animation using Matlab
Case 3
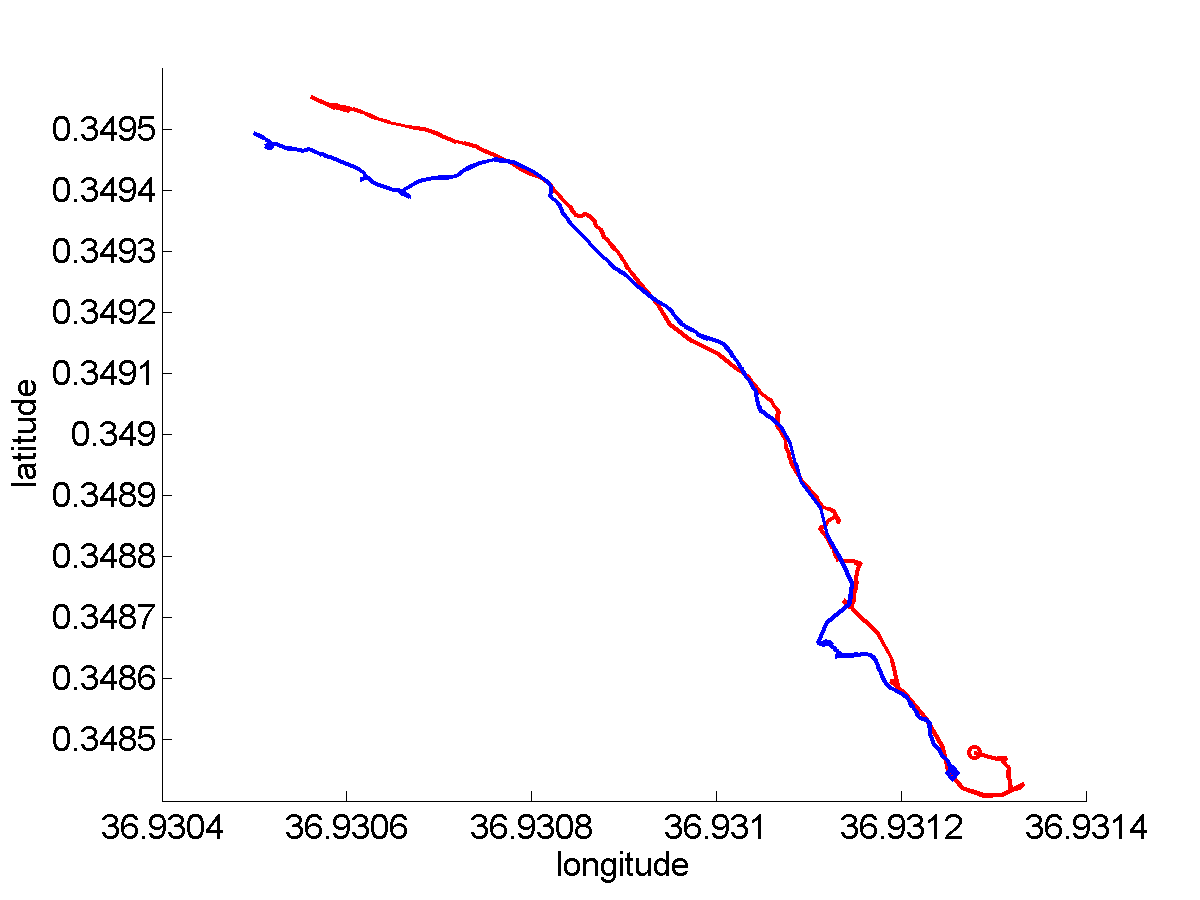
This video corresponds to the case showed in Figure 9(a). Baboon B (blue) follows A (red) between 10:00AM - 11:00AM on August 2. The corresponding interval is [2969:3221] (253 seconds). In the paper, We compared this range with REMO and LSA. REMO found 5 small intervals during this time period (Figure 9 in the paper). LSA (Figure 11 in the paper) either incorrectly reports this is a moving-together interval (with parameter 50 meters) or breaks it into multiple intervals (with parameter 25 meters).